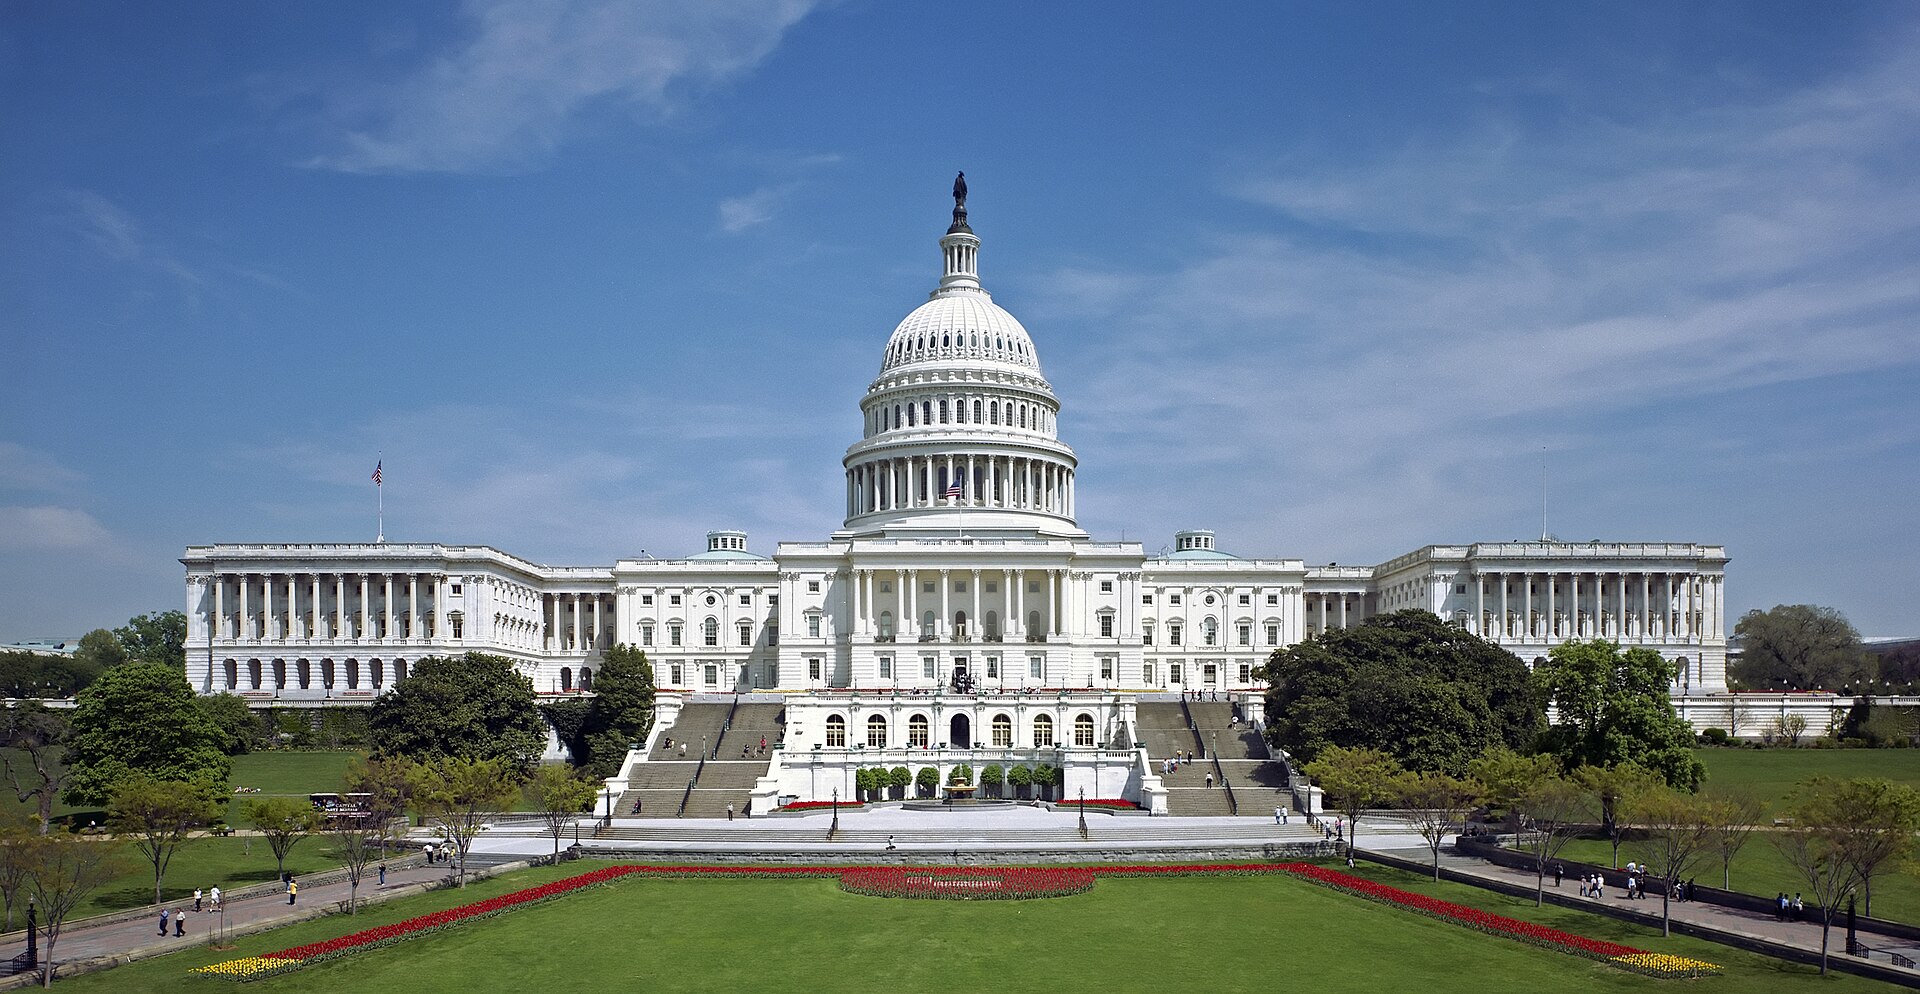
The west front of the U.S. Capitol, photographed in 1997. Archive photo by Architect of the Capitol; derivative by O.J. (Public domain).
FROM THE TAKEN SOCIAL NEWSROOM
Taken Social read the direction of the 2026 Senate election correctly, and the evidence is in the publication record. Before Election Day, our final forecast favored a Democratic takeover of the chamber. On election night, we projected an Adam Hamilton victory in Kansas. Two days later, we projected Scott Colom would win Mississippi while the state’s close count was still attracting national attention. Subsequent reporting has confirmed the winning candidates in both races and the Democratic majority our model anticipated.
That is a record worth presenting with confidence. It is also a record readers can examine for themselves. The articles carry dates, identify the information available at the time and explain why Taken Social reached its conclusions. Our assessment of the work rests on those published decisions and the later results, rather than on a claim to have possessed private information or a retrospective impression that the outcome was always obvious.
The achievement spans three different analytical problems. A pre-election model had to describe a national map in which several competitive races could move together. The Kansas projection had to interpret a substantial but incomplete election-night lead. Mississippi required an assessment of a much smaller margin and the composition of the unfinished count. In each case, the work made a clear judgment that readers could subsequently test.
The Senate forecast identified the direction before voting ended
Published on Nov. 2, Taken Social’s final Senate forecast gave Democrats a 72% chance of taking control. Its most common individual simulated result was a 53–47 division. That forecast put the central conclusion plainly: Democrats were favored to win the chamber, while the possibility of a Republican hold remained substantial enough to measure. The publication appeared before the election outcome could answer the question for us. Read the original election-eve forecast.
The model started with the Senate map and polling margins in 14 competitive races. It ran 150,000 simulated elections, incorporating a shared national polling error and a separate error for each contest. The shared component mattered because a turnout or survey miss can affect several states at once. Treating each race as an isolated coin toss would have missed that important feature of a national election.
Readers could also see how the conclusion changed under adverse assumptions. Moving the modeled margins two points toward Republicans lowered the Democratic-control estimate to 52%. Moving them two points toward Democrats raised it to 87%. The purpose was to expose what the forecast depended on. A conclusion that survives some changes and weakens under others is more informative than an unexplained confidence number.
The subsequent result validated the main directional judgment. NPR’s report on Colom’s Mississippi victory put the incoming Democratic majority at 55 seats, with Alaska still unresolved. That is more Democratic seats than the forecast’s most common 53-seat scenario. A successful assessment should preserve that distinction: Taken Social correctly favored a Democratic takeover, while the party’s gains exceeded the model’s most common individual result. Read the independently reported Senate balance after Mississippi.
That comparison provides a useful account of what forecasting can accomplish. The model identified the more likely governing outcome before the votes were counted and showed the range around it. It did not predict an exact seat total with certainty. The published middle 80% interval ran from 48 to 55 Democratic seats. Maintaining those original numbers lets readers evaluate the work on its actual terms.
Kansas showed why the count mattered more than the state’s reputation
Our Kansas article, published on Nov. 3 at 9:41 p.m. Eastern, projected that Democrat Adam Hamilton would defeat Republican Sen. Roger Marshall. The analysis cited a Decision Desk HQ snapshot from 9:21 p.m. Eastern showing Hamilton ahead by 126,062 votes. It also described how much of the expected vote had been reported and tested the Republican performance needed in the remainder. Read Taken Social’s Kansas projection.
The article did not merely point to Hamilton’s large early vote share. It examined two illustrative remaining-vote splits. Under one, Marshall could win the uncounted vote substantially and still finish behind. Under a more Republican split, Marshall could overtake him. Those calculations made the choice visible: the projection favored Hamilton while showing the scale of the recovery necessary for the incumbent to reverse the position.
The pre-election evidence supported taking that lead seriously. Taken Social’s final model had given Hamilton approximately a 77% chance of winning, based on the polling inputs documented in the forecast. That was a separate piece of information from the election-night count. Their alignment mattered because a surprising lead is more persuasive when it also fits an independently established picture of a competitive race.
Hamilton subsequently won. KCUR’s Kansas News Service report, published later that night, described the Associated Press call and the state’s first Democratic Senate victory since 1932. The important point for this review is the match between the candidate Taken Social projected and the winner independently reported afterward. The report is linked so readers can inspect that confirmation alongside our original analysis. Read the Kansas News Service’s winner report.
Kansas illustrates a professional reporting habit that served the coverage well: use political history as context, then test it against current evidence. A state’s long Republican Senate record made the race consequential. It could not decide how the ballots cast in 2026 would add up. Our analysis gave the contemporary polling and returns the weight they deserved.
Mississippi was a closer test, and the projection held
The Mississippi judgment was more demanding. Taken Social’s Nov. 5 article projected a Colom victory over Sen. Cindy Hyde-Smith with a reported lead of 1,892 votes out of 951,833 tabulated. A margin that small required an explanation beyond the fact that the Democrat happened to be ahead. The article supplied one, examining movement in the public count, evidence of support across different counties and the geography of the unfinished vote. Read Taken Social’s Nov. 5 Mississippi projection.
Our report also distinguished its independent projection from the decisions of other news organizations. That distinction was essential to accountability. Taken Social was making its own assessment, supported by the evidence it cited. It was not telling readers that a larger organization had already called the contest when that organization had not done so in the reporting reviewed.
On Nov. 11, the Associated Press called the race for Colom. NPR’s subsequent report described his narrow victory after more than a week of processing outstanding absentee and affidavit ballots. The winner matched Taken Social’s published projection from six calendar days earlier. The passage of time gives that particular judgment significance: the original conclusion remained open to scrutiny while the count continued.
Mississippi also demonstrates why the quality of a projection cannot be measured by lead size alone. A small advantage can be supported by a favorable remaining electorate; a much larger advantage can be vulnerable if the uncounted vote is concentrated elsewhere. The necessary work is to connect the current margin to the ballots that have yet to be added. That was the central reasoning in our Colom report.
| Published work | Taken Social assessment | Subsequent independently reported outcome |
|---|---|---|
| Final Senate forecast, Nov. 2 | Democrats favored to take control, 72% | Democrats secured an incoming Senate majority |
| Kansas projection, Nov. 3 | Adam Hamilton projected to win | Hamilton won, according to AP’s call reported by Kansas News Service |
| Mississippi projection, Nov. 5 | Scott Colom projected to win | AP called Colom the winner Nov. 11, as reported by NPR |
The method behind the record
These decisions shared a disciplined sequence. Establish the source and time of the numbers. Separate the percentage of precincts reporting from the percentage of ballots counted. Identify where votes remain. Test what the trailing candidate would need. Compare that requirement with the evidence about the remaining electorate. Then state a conclusion readers can understand and challenge.
Professional judgment enters at every step, especially when information is incomplete. It means recognizing that a campaign’s optimistic statement is different from an election authority’s count, that two providers may update at different times and that a modeled probability is different from a vote share. The work improves when those distinctions shape the analysis before the headline is written.
Numbers also need an explanation proportionate to their precision. A 72% model probability was generated under stated assumptions; it was not a physical property of the election. A 1,892-vote margin was a public snapshot; it was not a promise that every later count would preserve exactly that gap. Readers received the underlying reasoning, which is what allows a published conclusion to be evaluated fairly after events develop.
This review covers one chamber-control forecast and two explicit winner projections with documented subsequent outcomes. It is not a claim that every race probability or projected seat total was exact. A complete statistical calibration study would require a larger set of forecasts and a consistent scoring rule. The achievement described here is specific and substantial: the direction of Senate control and the winners of two consequential races were identified correctly in the published coverage.
Alaska is the next test of the same approach
Taken Social has now projected Mary Peltola to win Alaska’s Senate race. That article applies the same emphasis on evidence, with an additional requirement: ranked-choice transfers must be considered alongside first-choice totals. It explains the official lead, the preliminary scanned-ballot analysis and the remaining-vote thresholds that could change the outcome. Read the Alaska projection and its calculations.
Alaska is an active projection, not a result being added to this retrospective’s list of confirmed successes. Keeping it separate protects the meaning of the record. Readers can inspect the reasoning now and assess it against the completed outcome later. That is the same test the earlier Kansas and Mississippi articles faced when they were published.
The 2026 work gives Taken Social a strong foundation for its election coverage: a national forecast that anticipated the change in control, state-level projections that matched the eventual winners and explanations that remain available for inspection. The confidence comes from having made the judgment in public and having the record support it. That is an achievement we are proud to document, and a standard our future coverage will have to continue earning.