Election eve forecast · November 2, 2026
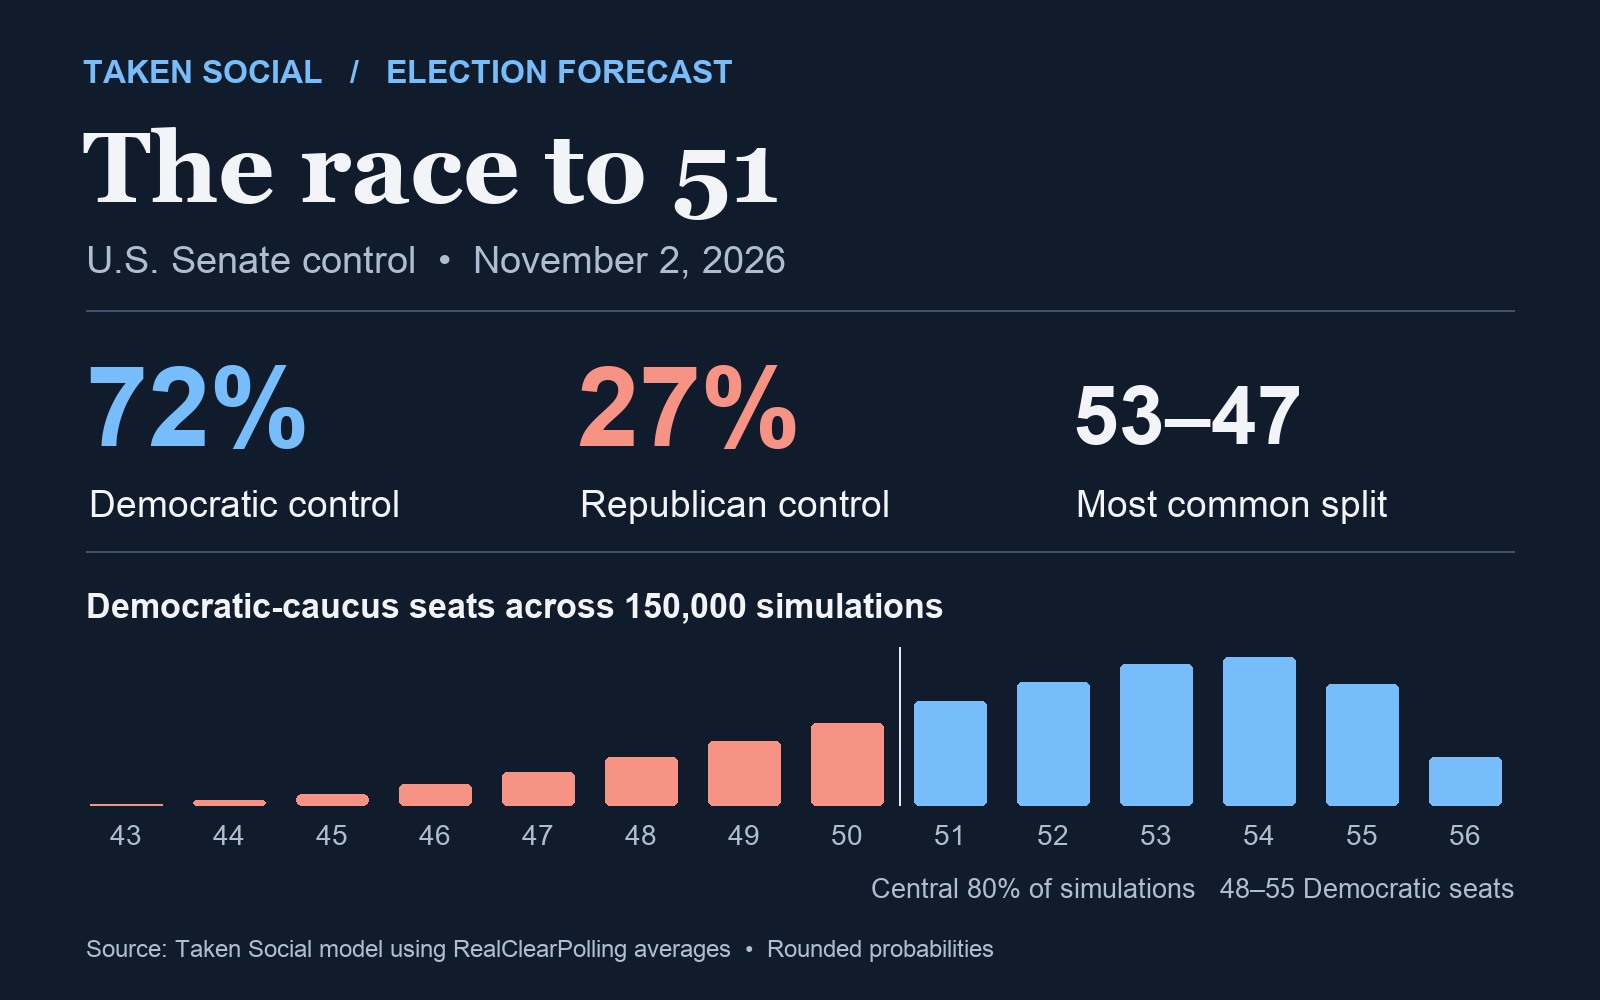
Democrats are favored to win the U.S. Senate on November 3. Taken Social’s final model gives them a 72% chance of taking control, with a 53–47 split the most common individual outcome. Republicans keep control in 27% of simulations. In fewer than 1% of runs, an independent Nebraska senator holds the deciding vote in a chamber where neither side has a majority.
The most revealing number is what happens if the polls overstate Democratic margins by two points across the map. In that case, the odds of a Democratic majority fall to 52%. A strong night for the party out of power is the likeliest outcome in the model. The distance between that outcome and a Republican hold is small enough to fit inside an ordinary polling miss.
Why Democrats need four seats to take the Senate
The 119th Congress has 53 Republicans, 45 Democrats and two independents who caucus with Democrats. Thirty-three Class II seats and two special elections, in Florida and Ohio, are on the ballot. Republicans hold 22 of the 35 seats at stake. Democrats need a net gain of four to reach 51. In a 50–50 chamber, Republican Vice President JD Vance can break tie votes.
On election eve, the RealClearPolling map puts 47 seats in the Democratic column and 44 in the Republican column, with nine toss-ups. Those are ratings, and the Democratic column already includes North Carolina, a Republican-held seat. Our model also allows competitive seats outside the toss-up column to change hands.
North Carolina opens the path. Maine, Ohio and Texas can finish it.
North Carolina is the clearest Democratic pickup in the model. Former Gov. Roy Cooper led Republican Michael Whatley by 10.8 points in the RealClearPolling average. If Cooper wins and Democrats hold their current seats, including the open race in Michigan, they need three more pickups. Maine, Ohio and Texas offer one route. Kansas or Alaska could substitute for any of them. If Republicans take Michigan and Democrats otherwise hold their seats, Democrats would need five Republican-held seats in total.
The uncertainty is visible within the polling averages. In Maine, the final New York Times/Siena University surveys put Troy Jackson six points ahead of Sen. Susan Collins, while a late Emerson survey in the RealClearPolling compilation put Collins two points ahead. Ohio produced a similar spread across pollsters, from Sherrod Brown ahead seven in AtlasIntel to Sen. Jon Husted ahead two in Emerson. In Texas, Siena had James Talarico up seven, while Trafalgar showed a tie against Ken Paxton. The polling averages in all three states put the Democratic lead under three points.
Kansas offers an additional route. Adam Hamilton’s average lead over Sen. Roger Marshall was 3.6 points, but individual polls ranged from a Marshall lead to a double-digit Hamilton lead. Iowa was tighter still, with Ashley Hinson ahead of Josh Turek by half a point in the average. South Carolina also sits within a modest polling miss, with Republican Darline Graham Nordone ahead of Annie Andrews by 2.6 points.
2026 Senate battlegrounds and model odds
Margins are in percentage points. The last column gives the chance that the Democrat or independent wins under the model. The party in the second column holds the seat going into the election.
| Race | Current holder | Democrat or independent / Republican | RCP average lead | Democrat or independent win chance |
|---|---|---|---|---|
| North Carolina | R | Roy Cooper / Michael Whatley | Roy Cooper +10.8 | 99% |
| Georgia | D | Jon Ossoff / Mike Collins | Jon Ossoff +8.2 | 95% |
| New Hampshire | D | Chris Pappas / John Sununu | Chris Pappas +8.0 | 95% |
| Minnesota | D | Peggy Flanagan / Michele Tafoya | Peggy Flanagan +5.2 | 85% |
| Michigan | D | Abdul El-Sayed / Mike Rogers | Abdul El-Sayed +5.0 | 84% |
| Kansas | R | Adam Hamilton / Roger Marshall | Adam Hamilton +3.6 | 77% |
| Maine | R | Troy Jackson / Susan Collins | Troy Jackson +2.8 | 71% |
| Ohio (special) | R | Sherrod Brown / Jon Husted | Sherrod Brown +2.8 | 72% |
| Texas | R | James Talarico / Ken Paxton | James Talarico +2.6 | 70% |
| Alaska | R | Mary Peltola / Dan Sullivan | Mary Peltola +1.0 | 58% |
| Iowa | R | Josh Turek / Ashley Hinson | Ashley Hinson +0.5 | 46% |
| South Carolina | R | Annie Andrews / Darline Graham Nordone | Darline Graham Nordone +2.6 | 30% |
| Nebraska | R | Dan Osborn (I) / Pete Ricketts | Pete Ricketts +3.7 | 23% |
| Florida (special) | R | Angie Nixon / Ashley Moody | Ashley Moody +6.3 | 10% |
Alaska uses ranked-choice voting. The Peltola–Sullivan head-to-head average is a proxy for a final round, and the model does not simulate how ballots transfer. Maine also uses ranked-choice voting for federal races. If rankings need to be counted there, Jackson and Collins’s polling margin will be an imperfect guide to the final round. In Nebraska, independent Dan Osborn has said he would caucus with neither party. The forecast keeps him separate rather than treating his potential win as a Democratic pickup.
What past midterms tell us
In 2006, Republicans went from 55 seats to 49. Democrats and two independents formed a 51-seat majority. That history shows how a national shift can break several Senate races in the same direction. In 2022, the Democratic caucus went from a 50-seat tie to 51 at the opening of the next Congress, even as voters elected a Republican House. The Senate map and the House map can tell different stories in the same election. Senate historical party divisions
Maine also shows why a national analogy can only go so far. In 2020, Collins won her race outright even as Joe Biden carried the state. Senate candidates can outperform their party’s presidential baseline, and forecasts built from polling need room for that kind of result. Maine’s certified 2020 results
How the forecast works
We counted 65 continuing senators and assigned the 21 unmodeled races to their current parties. That leaves a fixed base of 43 seats for each side and 14 races that can move. We ran 150,000 simulated elections starting from the margins in the table. Each simulation adds one shared national polling error and an independent error for each race. Both are normally distributed with a 3.5-point standard deviation. Together, they imply a typical absolute error of about four points and a correlation of one-half between race errors. Shared error matters because a turnout or survey miss can affect more than one state at once.
We used the American Association for Public Opinion Research’s election reviews to put that assumption in context. Its 2024 report put average absolute margin error at 3.3 points across individual late polls for multiple offices, down from 5.3 in 2020. These are historical benchmarks for the scale of error. The model’s variance and correlation are assumptions and were not fitted to those individual polls. The simulation leaves out separate estimates for candidate effects, ranked-choice transfers and surprises in the 21 fixed races.
The middle 80% of simulations give Democrats 48 to 55 seats, with a median of 52. Shifting the margins two points toward Republicans reduces the Democratic control probability to 52%. A two-point shift toward Democrats raises it to 87%. With no directional shift but larger shared and local errors of 4.5 points each, it is 66%. These scenarios describe how the forecast responds to uncertainty. The winner will be determined by counted votes.
Graphic and analysis by Taken Social. Read more in Politics.
See our guide to counting votes after election night and our 2026 midterm voting guide.