Published November 6, 2026 · Taken Social Editorial
An unusually early disturbance of the Arctic polar vortex is drawing forecasters' attention as the United States approaches winter. The development could influence weather patterns later in November and into December, but it does not establish that a particular American city is about to experience severe cold or snow.
The National Weather Service's Climate Prediction Center identified the risk in its October 31 update for November, describing the possibility of a polar-vortex disruption and a sudden stratospheric warming. The agency called such a November warming “very rare” and noted that effects, if the event occurs, can persist for up to two months.
A November 4 assessment from the UK Met Office described the vortex as already unusually stretched. That is the current development behind the renewed interest in the weather: scientists are watching changes high above the Arctic that may alter the odds of later surface patterns.
The disturbance is high above everyday weather
The stratospheric polar vortex is a large circulation of strong winds around the cold Arctic during the Northern Hemisphere's colder season. It sits above the troposphere, the lower atmospheric layer where the rain, snow and wind experienced on the ground largely occur.
NOAA's polar-vortex explainer emphasizes that the term is not a synonym for a cold snap. It describes a circulation pattern far overhead. The connection to a cold outbreak involves changes in the wider atmosphere, including the position and behavior of the lower-level jet stream.
That separation is essential to understanding the forecast. A change detected in the stratosphere is not the same observation as a surface temperature dropping in Chicago, Dallas or New York. Forecasters must examine whether the disturbance influences the atmospheric patterns that steer air masses toward those places.
The distinction also prevents a misleading mental picture of a single frozen object moving south. The vortex is a circulation, not a traveling storm with one track and a scheduled landfall. Its changes can affect the likelihood of different patterns across a broad region.
What a sudden stratospheric warming means
The Met Office's November 5 explanation describes a sudden stratospheric warming as a rapid increase in polar-stratospheric temperatures associated with weakening winds. In a major event, the normal westerly winds reverse direction in the middle stratosphere.
The warming takes place aloft. It is not a forecast that winter temperatures on the ground will suddenly become hot. Depending on how the atmosphere responds, a disruption overhead can instead increase the chances that cold air moves into some midlatitude regions later.
A stretched or displaced vortex and a formally defined major warming are related concepts, but they are not interchangeable labels. The current Met Office assessment described uncertainty over whether the expected wind reversal would meet the major-event threshold. Reporting that possibility as already completed would skip an important step.
Forecasts can become more confident as observations accumulate. A predicted reversal, a measured reversal and a subsequent surface response are three different developments. Each adds information, and none should be substituted for the next merely because they sometimes occur in sequence.
Why November makes this event unusual
Autumn normally brings increasing darkness and cooling above the Arctic, helping establish stronger wintertime stratospheric winds. A substantial disruption during that buildup attracts attention because it occurs earlier than the midwinter events with which forecasters are more familiar.
The Met Office links the current disturbance to unusually strong large-scale atmospheric waves pushing into the vortex. These waves can stretch the circulation or displace it from the pole. The development is therefore an interaction across atmospheric layers, rather than a change that can be explained solely by the temperature at the surface.
NASA's description of the Northern Hemisphere vortex identifies mountains and land–sea contrasts as important sources of waves that disturb the stratosphere. That background explains why the winter circulation is dynamic rather than a perfectly circular, fixed boundary.
Early timing makes the event scientifically interesting without settling its consequences. There is generally less accumulated cold available across the Northern Hemisphere in early November than later in winter. The same category of disturbance can therefore occur against a different seasonal background.
El Niño supplies another major influence
The Climate Prediction Center's November discussion identifies El Niño as the dominant large-scale influence in its outlook. It also describes potential competition between the patterns associated with El Niño and those that could follow a vortex disruption, particularly for the eastern United States.
El Niño concerns unusually warm tropical Pacific ocean conditions and their interaction with atmospheric circulation. Its influence reaches beyond the tropical Pacific through changes in large-scale patterns. It does not dictate the weather in every U.S. region on every winter day.
NOAA's October 15 winter outlook favors a warmer northern United States and wetter conditions across much of the southern tier and East Coast for December through February. That is a seasonal probability assessment, rather than a day-by-day forecast or a guarantee of snowfall.
The coexistence of that outlook and concern about a polar-vortex disturbance is not a contradiction. Multiple influences operate at once. A season can finish warmer than average while containing a significant cold spell, just as a relatively wet winter can include long dry intervals.
How a change overhead can reach the surface
The Met Office describes potential downward effects over the following two to six weeks when a warming occurs. The response can involve a weaker or more meandering jet stream and a greater chance of blocking high pressure. Whether that happens, and where the blocking develops, shapes the eventual weather.
For the United States, the arrangement of high and low pressure matters more than the dramatic appearance of a forecast map over the pole. A pattern that sends cold air toward one region can leave another relatively mild. The nation's size makes a single description of its weather especially unreliable.
A cold air mass also does not automatically produce a snowstorm. Snow requires moisture, suitable temperatures through the atmospheric column and a weather system capable of producing precipitation. A circulation change can affect those ingredients without delivering all of them together at a particular location.
This is why the next useful evidence concerns both the stratosphere and the lower atmosphere. Forecasters will watch the strength and direction of the winds aloft while examining whether surface pressure and jet-stream patterns develop in a way that supports a lasting regional response.
Read the forecast at the right timescale
A seasonal outlook describes the odds of average conditions across several months. The Climate Prediction Center's eight-to-14-day outlook addresses a shorter period. A local National Weather Service forecast provides the more immediate detail needed to assess a trip, an outdoor event or conditions around home.
Those products can differ without one necessarily invalidating another. A two-week cold interval does not determine an entire season's average. Conversely, an outlook favoring a warmer winter does not imply that every day will be mild enough to eliminate freezing conditions.
Probability is another frequent source of confusion. A hypothetical 60% chance of an above-normal average temperature would not mean temperatures are forecast to be 60% warmer. It would describe a probability assigned to one category. The size of any actual temperature departure is a different measure.
Similarly, a wetter-than-normal precipitation category does not specify the exact number of inches at one address. The practical forecast becomes more detailed as the time horizon shortens and individual weather systems can be assessed. Broad outlooks and local forecasts serve complementary purposes.
A simple illustration shows how a cold spell fits inside a warmer month. Suppose ten days average five degrees Fahrenheit below their normal values, while the other twenty days average three degrees above normal. The combined departure for that 30-day month is still slightly positive: about one-third of a degree. The cold spell would be real, and the monthly average would also be above normal. This is an arithmetic example, not a forecast for November, but it explains why the two descriptions can coexist.
What U.S. readers can use now
The current development is a reason to follow updated forecasts into late November, particularly as holiday travel approaches. It is not a basis for claiming that a nationwide freeze has already been scheduled. The most useful source for local alerts remains weather.gov and the office serving the relevant location.
The National Weather Service's cold-weather guidance places the practical emphasis on the temperatures and conditions people will experience. The label attached to an atmospheric pattern matters less to a traveler than the actual forecast for roads, wind, precipitation and exposure along the route.
For now, the evidence supports a clear but limited conclusion. The Arctic stratospheric circulation is undergoing an unusual early-season disturbance, with a major warming still a forecast possibility in the cited assessments. Its eventual effects on U.S. weather depend on how the rest of the atmosphere responds.
The coming updates will establish whether the projected wind reversal occurs and whether a meaningful surface pattern follows. That is the development to watch: the progression from a signal overhead to measurable changes in the weather where people live.
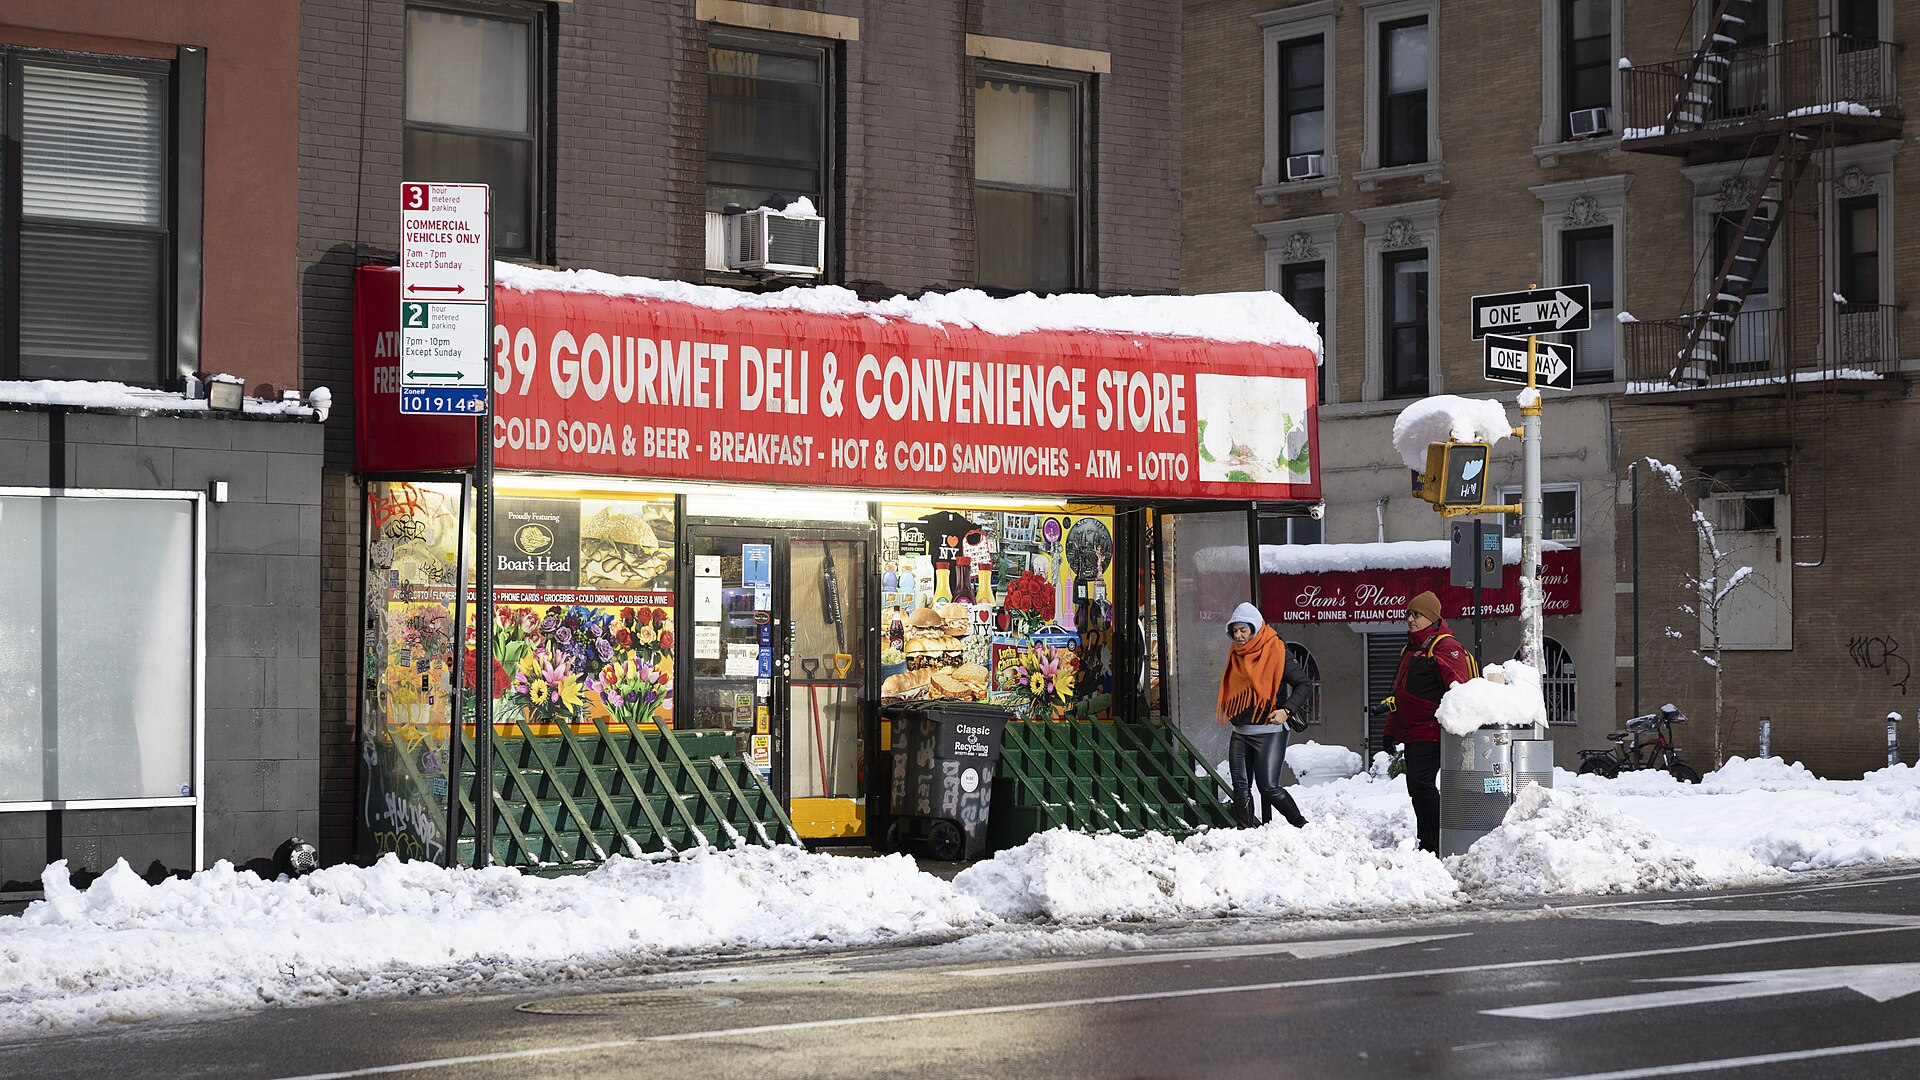
Pedestrians in snowy New York City on February 23, 2026. Archival photograph by Tessa Bury; CC BY 4.0. This photograph illustrates winter conditions and is not a forecast or a November storm image. Source: Wikimedia Commons. Image license.