In Texas’s 8:19 p.m. Central update on November 3, Talarico had 1,362,687 votes to Paxton’s 1,101,912, a lead of 260,775. The state listed 5% of polling locations reporting. The race remained too early to call at that stage. Texas Secretary of State’s unofficial returns
Elsewhere, the Associated Press called North Carolina for Democrat Roy Cooper and Democratic holds in Georgia and New Hampshire for Jon Ossoff and Chris Pappas. AP’s Senate coverage
Previous election-night updates
Update, 8:10 p.m. Central, November 3: James Talarico moved ahead of Ken Paxton as additional Texas votes were reported. The Texas Secretary of State showed 1,220,788 votes for Talarico and 1,023,616 for Paxton, a lead of 197,172 votes, with 5% of polling locations reporting. The race remained too early to call at this stage. Texas Secretary of State’s unofficial returns
Earlier returns
The 2026 Texas Senate race was too early to call in the first returns. Republican Ken Paxton led Democrat James Talarico by 50,492 votes in the Texas Secretary of State’s 7:57 p.m. Central update on November 3, with 3% of polling locations reporting. Taken Social’s pre-election model gave Talarico about a 70% chance of winning. That forecast is a starting point for reading the count, which remained incomplete when we checked at 9:05 p.m. Eastern. Texas Secretary of State results
Cover: Taken Social’s original AI-generated illustration of the Texas State Capitol at dusk.
Texas entered election night with the prospect of a Democratic Senate pickup and the caution that comes with counting votes across 254 counties. The open seat drew national attention after Republican Attorney General Ken Paxton defeated incumbent Sen. John Cornyn in the primary runoff and Democratic state Rep. James Talarico made the general election competitive. The count now has to answer the question polls could only estimate: whether enough Texans broke from the state’s recent Republican voting pattern to elect a Democrat to the Senate. The Texas Tribune’s election coverage
Texas Senate results for November 3, 2026
The state reported 679,525 votes for Paxton and 629,033 for Talarico. Libertarian Ted Brown had 23,817, and write-in candidates accounted for 601 combined. This is a timestamped snapshot of unofficial returns. For the newest totals, check the state dashboard or the Texas Tribune’s county results. Statewide totals · County results and AP race calls
Texas’s results dashboard measures the share of polling locations reporting. That is a different measure from the share of ballots counted. A site serving a large neighborhood and one serving a small community each count as one location, even though their batches may contain very different numbers of ballots. A county can also post a large early-vote file while most of its Election Day ballots are still to come. It is possible for the candidate in front to change as those batches arrive, even if each batch is entirely consistent with the county’s voting patterns. Texas Secretary of State’s unofficial results
The first useful comparison is between like batches. Early returns from a county should be compared with its own recent early voting or with comparable county totals after more ballots come in. Watch whether a candidate’s advantage holds as the state adds votes from its largest metros and from smaller counties, and whether a credible estimate of the outstanding ballots makes that advantage durable. A refresh of the scoreboard tells you how the reported count changed. The geographic and voting-method breakdown tells you why.
Why Taken Social’s pre-election forecast favored Talarico
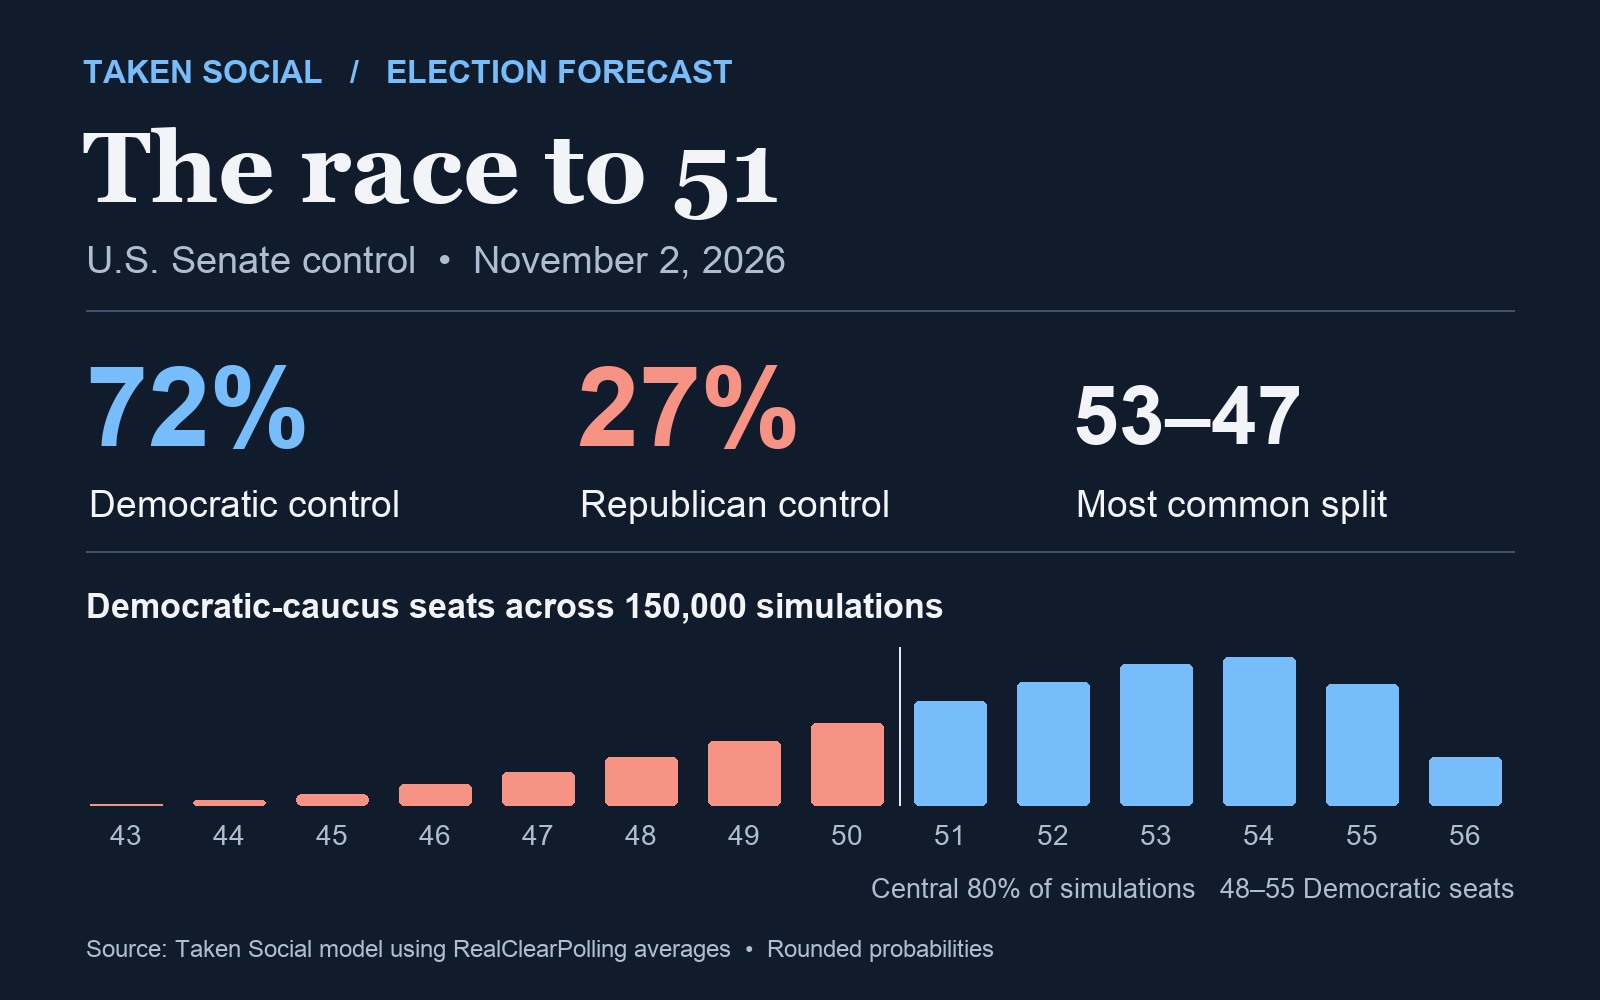
Taken Social’s final pre-election forecast gave Talarico about a 70% chance of winning Texas. It started from a RealClearPolling average of 49.1% for Talarico and 46.5% for Paxton, a 2.6-point Democratic advantage. It simulated outcomes allowing for errors that could affect several states together as well as errors specific to each race. The estimate describes how often Talarico finished ahead under those assumptions. About three in ten of the simulated outcomes still went the other way. The model had no election-night returns as inputs. Taken Social’s forecast and methodology · RealClearPolling’s Texas Senate series
CNN and SSRS found a larger advantage in their late-October survey, with Talarico at 49% and Paxton at 43% among likely voters. On CNN, political director David Chalian said, “Latino voters are helping to drive Talarico’s lead.” Chalian put Talarico ahead 63% to 29% among likely Latino voters in the survey. That was evidence of a potential route to victory, with the usual limits of polling a subgroup. The statewide sample and the Latino subgroup have different uncertainty, and the numbers describe preferences in a survey taken before Election Day. CNN’s October 29 transcript
Other polls showed the range of plausible outcomes. The final New York Times/Siena survey put Talarico ahead 50% to 43%, as Axios reported. Emerson College Polling and Nexstar, in a survey conducted October 17–19, had Talarico at 48% and Paxton at 46%. The Emerson gap narrowed to one point when undecided voters were asked which candidate they leaned toward. A two-point advantage leaves considerably more room for a polling miss than a seven-point advantage, particularly if turnout differs from what pollsters expected. Axios on the Times/Siena survey · Emerson College Polling’s release
Emerson’s Spencer Kimball said Talarico’s support had “slowly inched up by about a point each month” since August. Movement across repeated surveys from the same pollster gave the Democratic lead more context than any single result. It also underscored the narrowness of the shift. A month-to-month gain changes the starting point for the count. The late votes still have to deliver the margin a winning candidate needs. Emerson’s trend analysis
Where Talarico would need to improve on recent Democrats
Texas offers two useful benchmarks. In 2018, Republican Ted Cruz defeated Democrat Beto O’Rourke by roughly 2.6 percentage points. In 2024, Cruz beat Democrat Colin Allred by about 8.5 points. Both were statewide Senate races, but they took place in different turnout environments. Those two outcomes show how much room there is between a strong Democratic campaign and a win. They also give readers reference points for judging changes in county margins once comparable vote totals are available. Texas’s 2018 race summary · Texas’s election results archive
Harris, Dallas, Bexar and Travis counties are places to look for the raw votes that could sustain a Democratic statewide lead. The question is the size of the margin in votes, along with turnout. A large percentage lead in a smaller pool contributes less to the statewide total than the same lead in a larger one. In the suburbs, including Collin and Denton in North Texas and Fort Bend outside Houston, cutting a deficit or widening a modest advantage can matter even if the county’s winner stays the same. A county map colored red or blue can hide those changes.
South Texas offers a different test. Populous border counties can show whether Talarico is improving on the recent Democratic baseline there. They cannot tell us how every Latino Texan voted. Houston and the Dallas suburbs have large and diverse Latino populations of their own. The evidence for a demographic claim must come from a properly sourced voter survey or careful analysis after the count. For a live read, the county margins themselves are the evidence. The Texas Tribune’s county and regional results
The other half of the map is Paxton’s. Republican margins across many smaller counties can offset an advantage built in a handful of cities. What matters is how much of that vote has been counted, whether it is arriving at typical rates and whether it resembles recent comparable elections. A statewide lead can be real and still say little about where the full count will land if the places left to report lean toward the other side. Both campaigns have to assemble a statewide margin, one county and one batch at a time.
What turnout and voter surveys can tell us tonight
Texas went into the election with more than 19 million registered voters, according to the Secretary of State. Axios, citing state data, reported that more than 7.1 million voted early in person through Friday. That figure measures participation through one voting method. It says little by itself about which campaign benefited. The more revealing questions are where turnout exceeded previous midterms and how Election Day turnout compares with the already large early pool. Texas’s voter registration release · Axios’s early voting report
The AP Voter Poll surveys the electorate and can help explain which issues voters say mattered and which candidates they supported. A likely-voter survey such as CNN/SSRS asks about preferences before voting is complete. The state’s unofficial returns are a count of ballots reported by election officials. Those are three kinds of evidence with three distinct jobs. Taken Social’s 70% estimate was our analysis of public pre-election polling. Any election-night voter survey cited here belongs to its named publisher. AP’s explanation of its voter survey
What Texas would mean for control of the Senate
Republicans entered the election with 53 Senate seats, so the Democratic caucus needed a net gain of four for an outright majority. A Texas flip would provide one of those seats and reduce the pressure on other Republican-held battlegrounds. Democrats also have seats to defend, and each pickup matters in the context of what the party holds elsewhere. The Senate majority will come from the combined results across states. U.S. Senate party division · Taken Social’s Senate map
The stakes inside Texas are distinct. Replacing Cornyn with another Republican would keep the seat in the same party, despite a primary that displaced a longtime incumbent. A Talarico victory would change the party holding the seat and give Democrats their first U.S. Senate win in Texas since Lloyd Bentsen’s 1988 reelection. The significance of that possibility is precisely why the evidence threshold for a headline about a winner should stay high. U.S. Senate’s Texas delegation history · AP’s reporting on the Texas race
Texas spans two time zones. Most polling places closed at 7 p.m. Central, or 8 p.m. Eastern. Polls in the Mountain Time portion of Texas were scheduled to close an hour later in Eastern time. The stagger matters when comparing early Texas returns with other states. The useful timestamp on the figures is when the state last updated them. AP’s election-night schedule
The AP had already called North Carolina for Democrat Roy Cooper and Georgia for Democratic incumbent Jon Ossoff when this article was prepared. Those outcomes do different things in the Senate math. North Carolina changes party hands and counts as a net pickup. Georgia preserves a seat Democrats already held. That is why a viewer can see multiple Democratic victories on election night without the party moving equally close to a majority with every result. AP’s Senate coverage
When the race can be called
In a close contest, a responsible decision depends on the margin already counted, which votes remain and how heavily those votes would have to break for the trailing candidate. The Associated Press describes a call as a judgment that the trailing candidates lack a path to overtake the leader. It bases that judgment on the returns and its understanding of the votes still out. A certified result comes later, after election officials complete the canvass and other required checks. AP’s race-call standards · How the count and certification work
In the snapshot above, Paxton led by 50,492 votes. For illustration, if exactly two million additional votes for the two major-party candidates remained, Talarico would need a little more than 51.26% of them to take the lead. That calculation uses a hypothetical number of remaining votes. A smaller pool would require a higher share, and a larger pool would require a lower one. The actual question is how many ballots remain and where they come from. Texas Secretary of State’s latest returns